

I opened a page on my website that I had never visited before and it just sat there blank. Ten, twenty, sometimes thirty seconds. Then it loaded, and after that it opened in an instant. The strange thing was that I had not pushed any big change. The site is CifraLab, a chord site running on Cloudflare Pages.
My first thought was the worst. That I had broken something with the cache, that my visitors from South Korea were leaving because of it, or that I had been hacked. It was none of those. Here is how I ruled them out one by one on November 18, 2026, with the commands I used.
What I was seeing
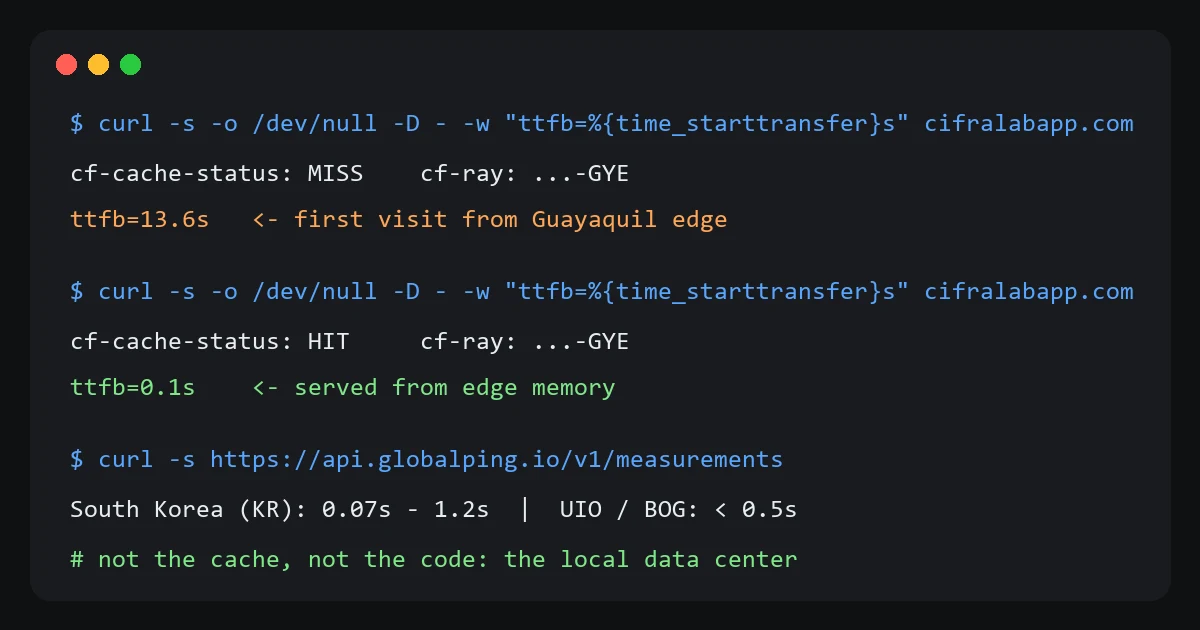
Four days earlier I had added a cache rule in Cloudflare. It stores the HTML of pages for one day at the edge, which is the Cloudflare server closest to the visitor. The first visit to a page comes back as MISS and Cloudflare goes to fetch it. The next ones come back as HIT and arrive straight from memory.
With curl the difference is obvious. I requested the same page twice in a row and checked the time to first byte.
curl -s -o /dev/null -D - -w "ttfb=%{time_starttransfer}s\n" https://cifralabapp.com/it/ukelele/The first request took 13.6 seconds. The second took a tenth of a second. I tried other pages and the number kept repeating almost down to the decimal, 13.6. One hit 37. A number that consistent usually means a timeout followed by a retry.
Was it my connection or the site?
curl splits the timing into parts. That tells you whether the delay is on your internet connection or on the server.
curl -s -o /dev/null -w "dns=%{time_namelookup} tcp=%{time_connect} tls=%{time_appconnect} ttfb=%{time_starttransfer}\n" https://prueba.cifralab.pages.dev/it/piano/acordes/DNS, the TCP connection and TLS took under a tenth of a second. Everything else was waiting for the page to arrive, 15.6 seconds in that run. My connection reached Cloudflare fast. The slow part happened inside.
Was it the cache rule?
That was my main suspect. Before adding the rule, the site felt fast, and in the Pages documentation I read that caching HTML on a custom domain is not recommended. I wanted to turn it off.
Before touching production I used my preview copy. That copy lives on a pages.dev address and does not go through the custom domain cache rule. I tested the exact same 20 unvisited pages on both sites. Here is what happened.
- Production, with the rule. 11 out of 20 took over 3 seconds, averaging 7.2 seconds with a peak of 22.8.
- Preview, without the rule. 10 out of 20 took over 3 seconds, averaging 8.2 seconds with a peak of 23.9.
Without the rule it behaved the exact same way. The cache was not to blame. On the contrary, it was the only thing protecting everyone else, because only the first visitor had to wait.
Was it my recent code changes?
I had edited quite a few files that week. So I deployed a build from November 9, before all those changes, to a separate URL. I also tested Workers with static assets, which Cloudflare now recommends instead of Pages. I measured 20 fresh pages across all three.
- Older build from November 9. 5 out of 20 took over 3 seconds, worst was 26.5.
- Current build. 5 out of 20 took over 3 seconds, worst was 22.1.
- Copy on Workers. 10 out of 20 took over 3 seconds, worst was 20.9.
The older build was just as slow. Workers was too. It was neither my code nor Pages specifically.
Measuring from other countries
I still needed to know what real visitors were seeing. Most of mine come from South Korea. To test from there I used Globalping, which lets you request a page from probes in different countries with a free API.
curl -s -X POST https://api.globalping.io/v1/measurements -H "content-type: application/json" -d '{"type":"http","target":"cifralabapp.com","locations":[{"country":"KR"}],"measurementOptions":{"protocol":"HTTPS","request":{"path":"/ko/piano/acordes/em/"}}}'It returns an ID. With https://api.globalping.io/v1/measurements/<id> you read the timings and headers. From South Korea, ten fresh pages loaded between 0.07 and 1.2 seconds. No long stalls at all.
I also tested from Quito, Cuenca, Bogota, Sao Paulo and the United States. All came back under half a second, except one 2.3 second load in Quito. It was only happening to me.
The header that explained it
Every Cloudflare response includes a cf-ray header. Its last three letters tell you which data center handled your request. On my PC they ended in GYE, which is Guayaquil. The other probes in Ecuador routed through UIO in Quito or BOG in Bogota.
curl -s -o /dev/null -D - https://cifralabapp.com/ | grep -i cf-rayThere it was. My ISP routes my traffic to Cloudflare through Guayaquil. When that data center does not have the page cached yet, it goes to fetch it from where Cloudflare stores the files, and that trip sometimes stalls. The other data centers I tested did not have that issue. Cloudflare explains on its blog that Pages stores static assets in Workers KV and those stores are far away, which is why caches sit in front of them.
This last part is my own conclusion from the measurements. Cloudflare has not confirmed it to me. On their community forum I found someone else reporting 10 to 40 second stalls on Pages with no clear explanation.
Ruling out a hack
When something only happens to you, it is natural to worry that your PC is compromised. On Windows I checked the basics in PowerShell without changing anything. First, whether any proxy was intercepting traffic.
netsh winhttp show proxy
Get-ItemProperty 'HKCU:\Software\Microsoft\Windows\CurrentVersion\Internet Settings' | Select-Object ProxyEnable, ProxyServer, AutoConfigURL
Next, the hosts file and DNS servers. If someone wants to send you to a fake site, they usually touch one of those two.
Get-Content C:\Windows\System32\drivers\etc\hosts | Where-Object { $_ -notmatch '^\s*#' -and $_.Trim() -ne '' }
Get-DnsClientServerAddress -AddressFamily IPv4
The most useful check was seeing who signed the TLS certificate my PC received. If someone sits in the middle of your connection, another issuer shows up. Mine showed Google Trust Services, which Cloudflare uses. There were no new root certificates added in the last 90 days either.
Get-ChildItem Cert:\LocalMachine\Root, Cert:\CurrentUser\Root | Where-Object { $_.NotBefore -gt (Get-Date).AddDays(-90) }Everything was clean. And there was another clue. If I had been hacked, every page would be slow, not only the ones Cloudflare did not have cached yet.
What I did in the end
I kept the cache rule. It is the reason only one visitor hits the wait instead of everyone. I did not migrate to Workers, because the exact same delay showed up there. I deleted the test copies and put together a report for Cloudflare with these numbers and the Guayaquil cf-ray headers.
What I kept asking myself along the way
Is this why my South Korea visits dropped? No. From South Korea the pages load in one second or less. The drop matches Naver showing the site less often in search results, which is a separate issue.
Would removing the cache fix it? No. The test without cache had the exact same stalls. Turning it off would only force every visitor down the slow path.
Does Workers cost more than Pages? Not for static files. Requests for static assets are free and unlimited. Only requests that run Worker code count, and the free plan gives 100,000 per day.
Was I hacked? From everything I checked, no. No proxy, no edited hosts file, no strange certificates and no suspicious background connections.
If you run into something similar, check the cf-ray header and test from another country before changing your setup. It would have saved me an entire afternoon.
Comments
Write a comment